Predicting NBA MVPs: Utilizing Random Forest Model for Accurate Award Share Predictions
Never again.
A subtle but important principle of my blog is that I try to stay away from legacy or award talk, unless it really intrigues me. In most years, awards like the MVP don’t really pique my interest - it’s cool and a fun debate, but the party is usually crashed by fans or media people just looking to fan the flames. More importantly, coming to a rock-solid conclusion is very difficult. The goalposts seemingly keep changing every year. So what’s the point of this post?
Well, for one, I just wanted to keep coding and two, I was pretty bored last night. Zero part of me actually thinks these results mean anything more than just predicting how people vote - so if you’re thinking this is a way to prove who the “best” player in the NBA was, that’s much more difficult (and something that way more brilliant people than me haven’t been able to truly conquer yet).
As for the accuracy of the model - honestly, pretty good - it got a lot of years’ top three in the correct order - but there were some interesting results in the more contested debates of the last four decades.
Methodology:
There are technically two ways to do this.
Classification: A classification model would just say, “Hey this player won the MVP and this player didn’t. Here are the stats, explain why.” Intuitively, one could understand this is not the way to go. But how do you get more than that?
Regression: So I knew it had to be a regression model, but how? Do I assign a value like 1 or 2 depending on where a player finished in MVP voting in a particular year? Luckily, there exists a stat called award share, which basically calculates the votes a player got as a percentage.
I chose a Random Forest Model because it’s less prone to overfitting and also can handle a large number of zeros better than a Linear Regression Model would (which is important in a dataset where most players, even ones with higher stats, don’t get any award share). I also tried using other models. Gradient Boosting showed promise and had good accuracy but required more tuning and was computationally more expensive. XGBoost, known for its performance, was another strong contender. However, it also required extensive parameter tuning and did not significantly outperform the Random Forest in our tests. Ultimately, I decided on the Random Forest model due to its balance of accuracy, interpretability, and ease of use.
I found a wider list of features using Recursive Feature Elimination, and then isolated the ones to have good correlation and what I believed to be important value. Some stats that were considered were total win shares and win-loss percentage for that season, which have great correlation but I thought this would skew the model too much in favor of players on great teams - which might make the model more accurate - but I wanted to have some combination of both “who should have won” the MVP and “ who will win the MVP”.
The features used were Player Efficiency Rating (PER), a comprehensive metric that summarizes a player's statistical accomplishments in a single number; Value Over Replacement Player (VORP), which estimates each player’s overall contribution to the team relative to a replacement-level player; Win Shares per 48 minutes (WS/48), an estimate of the number of wins a player contributes per 48 minutes; Points per Game (PTS), a fundamental measure of a player’s scoring ability; and Box Plus/Minus (BPM), a box score-based metric that estimates a player’s overall impact on the game.
All of these, besides PPG, are advanced stats - and as usual, PPG has an important correlation to awards and money - maybe because of its interpretability. I left it in because I think in some ways - handling offensive load is important and the players that won MVP often outperformed their offensive load significantly. What you might notice is the lack of many advanced defensive stats. The issue is that most advanced defensive stats correlate to positions - I chose defensive win shares as it estimates (maybe poorly) the number of wins a player produces due to their defensive play.
Our Random Forest model demonstrated a solid performance in predicting MVP award shares. The model achieved an R^2 score of 0.7220, indicating that it could explain a significant portion of the variance in the award shares. The mean squared error (MSE) and mean absolute error (MAE) metrics also showed that the model's predictions were reasonably close to the actual values.
Well, enough of this boring stuff - I guess you want to see who won the MVP each year. I actually ran through all of the years - so I’ll put the ones I found most interesting along with a link to a separate post that has all of the results from every year.
Results and Analysis:
Click on this for the results from 1982-2022.
1985:
Jordan finishes 2nd in his rookie season.
1990:
1990 was a historically great MVP race, with Magic winning and Barkley and Jordan finishing 2nd and 3rd respectively. The predicted score gives it to Jordan by a significant margin - he finishes with the most predicted MVPs in this exercise.
2003:
An underrated MVP race - 2003 sees McGrady take the award home instead of Tim Duncan. I think an important feature was taking out Win-Loss Percentage, which might have swayed the award in favor of Duncan this year.
2005 and 2006:
I think the 2006 MVP Race is probably the most controversial - there’s a large contingent of Kobe fans who say Kobe was robbed of the MVP and that Nash should not have won. Unsurprisingly, this model doesn’t give Nash much credit - this is my biggest gripe with including PPG in my models and definitely something I’m going to retest without. Funnily enough, the model doesn’t give Kobe the award (despite averaging 35 points per game that year) - instead LeBron wins his second predicted MVP award (a streak he belts off from 2005 to 2011).
I added 2005 just because Shaq has constantly griped about Nash robbing him of two (which, even forgetting the model, isn’t accurate) MVPs. In 2005, the year Shaq finished 2nd - he didn’t even finish in the top 5 of our predicted model. Looking at why Shaq and Nash might have finished so high - an important feature I need to calculate is added win percentage from the previous season.
2011:
There was a greater chance of the arena in Cleveland being named after LeBron than him winning the MVP this season - coming fresh off The Decision - he was the “villain” of the NBA, while Derrick Rose was the new kid on the block. What I found is that the element of MVP voting that is hard to quantify is the narrative of “he’s supposed to do this” vs. “this is new”.
2013:
This is the most surprising result of the exercise. LeBron, in his near unanimous MVP season, loses the predicted MVP by a significant margin to Durant.
2024:
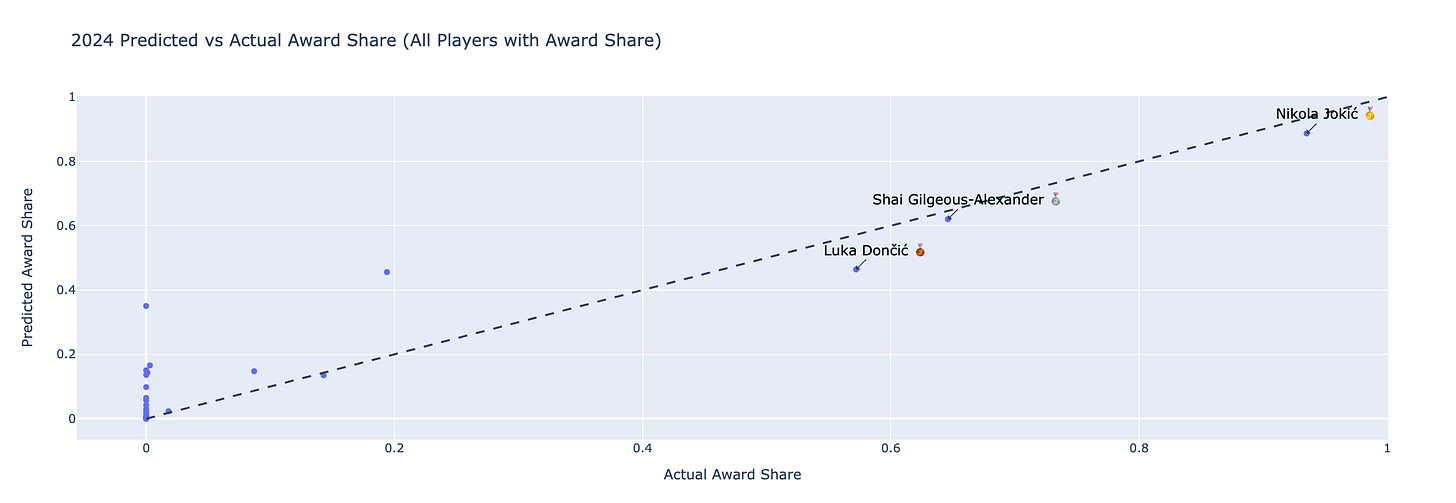
Our model gets the MVP voting exactly correct for 2024, with a wide margin between Jokic and Shai/Luka. Not surprised given Jokic’s perfection in analytics.
Overall this was a fun exercise and more informative than I thought it would be - but I still maintain that it’s a little silly. I’ll try to host my MVP prediction model so that it can live-track results for next season, but don’t expect to beat the books or anything.
On a different note, I plan on taking a break from analytics content at least for a week. I’ll try to supplement with some Olympics content and other basketball things.
If you enjoyed this content, please subscribe! I post pretty often and this blog is growing pretty rapidly. I don’t paywall anything.


