
True Rebounding Rate
A preliminary metric that factors context into rebounds.


I mentioned in a previous post my interest in measuring the rebound, which, to say the least, is an underrated action in basketball. My theory around rebounding centers around why we call it important in the first place. Traditional rebounding stats focus on preventing second-chance points, but that’s only half the story. A great rebound doesn’t just stop the opponent—it creates offensive advantages.
My analysis of the defensive rebound separates it into two parts:
Preventing the opposing team from getting another possession.
Earning transition points efficiently on the other end
The second part is more niche, yet, in the modern NBA, also important. It gives rebounders who don’t have to immediately find a ball handler a little more shine. I’ll walk through this visually.
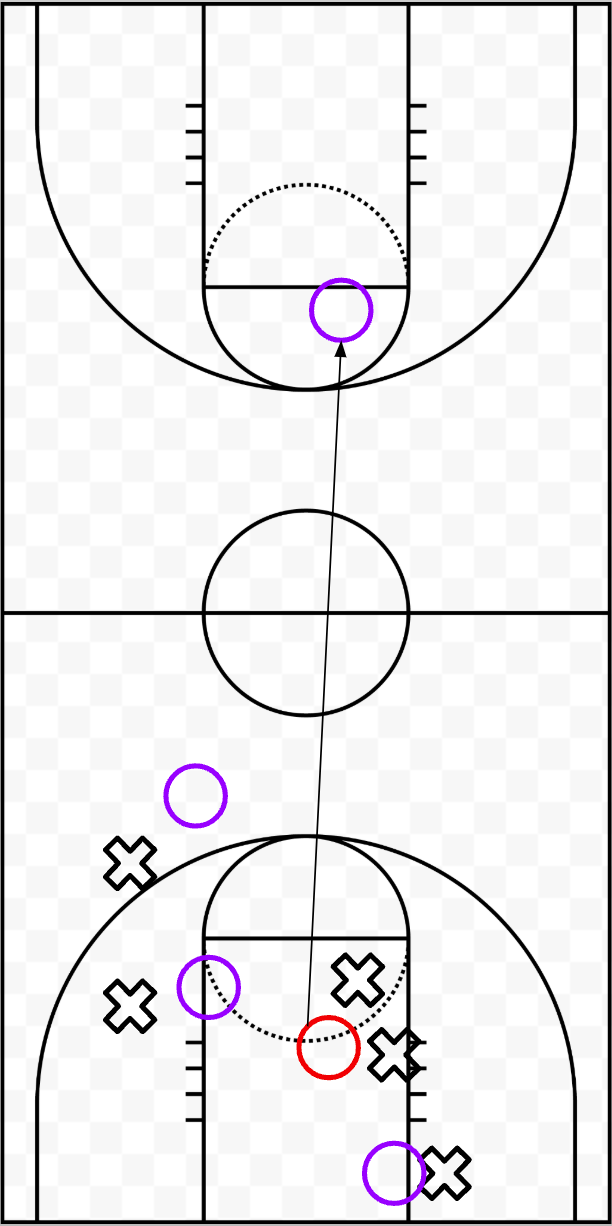
As you can see from this (an action that is somewhat simplified but common), the rebounder (red circle) who can effectively make an outlet pass pulls down a more valuable rebound than one who just grabs it to set up a half court offense.
This also follows from simple intuition regarding matchups. If one player bursts to the other side of the court rather than crashing the boards, and his defender runs inside to grab a rebound (which is more common than you think), the team on the defensive glass is 4 v 5 on the glass. This makes a rebound that they grab more difficult and therefore more valuable.
You might ask, why is it more valuable just because it’s more difficult? After all, difficulty does not always result in more points. But this all extends from a greater line of thinking - difficult shots is also equal to MORE value in basketball. Just like a shooter who makes contested threes bends defenses, a rebounder who consistently wins tough boards forces opponents to adjust, shifting defensive positioning and creating transition opportunities.
So how do we measure contested rebounds vs. uncontested rebounds then? Fundamentally, rebounding percentage is too raw, and most rebounding stats treat all boards equally. But grabbing a contested rebound in traffic is not the same as collecting an uncontested one when the defense has already given up. This is not always the case. But the preventative value of that type of rebound is lower, as you have a greater radius to locate the ball and therefore the opponent is less likely to turn that ball into another possession.
So, ultimately, we want to find a way to adjust rebounding rates for how contested the rebound is, and also the offensive value of the rebound. The following metric is an attempt at that.
True Rebounding Rate:
I call this metric true rebounding rate because I believe it does a significantly better job at accounting for game factors compared to most other rebounding metrics. To break it down, let’s start with the first term.
I wanted to apply weights to contested and uncontested rebounds as I mentioned previously. Therefore, the first term is:
(CREB * w1) + (UREB*w2)
Based on the methodology before, I decided to start my weights at w1 = 1.5 and w2 = 1.0, but adjusted it to 1.25 and 0.9 so the overall metric would have less sensitivity to this. It still follows that uncontested rebounds are worth less than contested rebounds as they have less preventative value.
The second term of my metric took a little more effort. Using the hoopR package in R, I was able to extract a fastbreak rate (following defensive rebounds) for every team in the league using play-by-play data.
I used six seconds between defensive rebounds and a shot attempt to determine if this was a fastbreak. Most importantly, accuracy is NOT included in this metric. This is for a few reasons. This metric is measuring rebounding, not fastbreak efficiency. While these are certainly linked, the rebounder should not be penalized for his teammate missing on a fastbreak attempt. In addition, stoppages and turnovers are also excluded. This makes the metric imperfect. A better strategy given more tracking data would be verifying the formation of a team following a rebound and how optimal that is for a fastbreak. However, I do believe my metric is giving insight not previously seen.
The second term is as follows:
((CREB * w1) + (UREB*w2) + ((Fastbreak Rate - League Average Fastbreak Rate) * (DREB Chances * DREB Chance %)) / (DREB Chances - Deferred DREB Chances)
This adds a “potential rebounding chances” term on top of the rebounds the team already grabbed. By doing this, we put teams on an even playing field - teams that run fastbreaks and play 4 v. 5 on the glass are therefore not penalized for their lower DREB Chance%. I also subtract Deferred DREB Chances to stay in line with the adjusted defensive rebounding chance percentage on the NBA website.
In addition, I considered (and will likely in the future) adding a γ constant to the fastbreak impact term to potentially adjust the sensitivity to the fastbreak rate. In future this term will likely be < 1.0.
For now though, the results are interesting and better than I expected:
The results reveal clear differences in team rebounding philosophy. Detroit jumps to #1 due to its combination of strong rebounders and quick outlet passing, while Denver soars from #9 to #2, showcasing Jokic’s elite transition playmaking.
This shows some teams with bigger deviations than expected. The Cavaliers are the most surprising drop off to me, as Mobley has started to initiate more offense this season. Obviously though, this metric is not completely accurate - the way I tracked fastbreaks is imperfect and doesn’t factor in transition defense as well as it could.
For now though, this is a preliminary effort and I decided to demo some of the work I’ve been doing over the last few months. Use the results at your own discretion. Finally, just as an added bonus - I decided to calculate the the best rebounding-transition pairs in the NBA.
This metric still needs refinement, but I’m excited by its potential. Even now, it’s making steady progress beyond the rebounding metrics we rely on to predict team success.
Love this!