
The "No-Stats All Star" vs. Charles Barkley and the Box Score
A breakdown of Shane Battier and the 2007-08 Houston Rockets.

In my last piece, I talked a bit about how my own fascination with analytics came about and some of the additional principles that give the niche such a foothold in front offices. In this article, I wanted to discuss some of the ways that a player applied analytics to their own game and the effect on that player’s team.

15 years ago, Michael Lewis, best known for his book Moneyball: The Art of Winning an Unfair Game, wrote an article for the New York Times about Shane Battier, a forward for the Houston Rockets. The article, titled “The No-Stats All-Star”, identified Battier’s effect on winning and why the box score (along with some other metrics) failed to capture his total impact. Lewis, whose book had already changed the baseball landscape, gave insight into some of the ways that analytics had started to shift basketball philosophies.
Battier is an interesting study to say the least. As Lewis details, his base physical measurements don’t stick out, and then on further game analysis, he’s not particularly quick. Of course, physical limitations do play a role on any team - despite Battier’s proficiency on defense, you would never stick him on Chris Paul or Dwight Howard. Night after night though, Battier guarded the best wing on every team with great success. Here is a visualization of the All-Star guards/forwards Battier consistently got a chance to match up against, from 2006-2009.
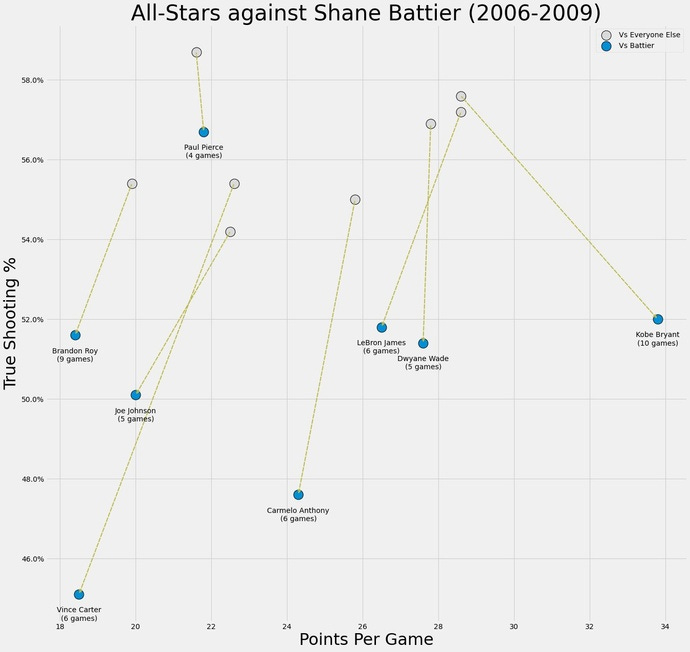
Battier was probably not who most players looked forward to seeing very often. The most famous of Battier’s duels came against Kobe, of whom there were ten matchups between.
Battier’s defensive success was driven partly by his mind. Daryl Morey noted that Battier was the only player on the Rockets who would receive access to the very sophisticated matchup data, with shot zones and details on off-hand efficiency. There was an internal confidence that Battier could translate the numbers to an in-game performance, which analytics people often struggle communicating. Battier was not just a player who saw the numbers, he was a believer in analytics itself.
An appropriate foil for Bryant, Battier was an unceasing student, who studied defensive matchups like it was the night before an exam. Kobe, well-known for his own maniacal preparation, scoffed at Battier’s supposed defense on him - but the numbers just didn’t lie. There was something Battier was doing.
This possession is a good example. Battier funnels Bryant into the top of the key and then puts his hand in front of Bryant’s face, not the ball, which leads to an airball. Battier came up with this technique long before joining the Rockets, and it played a part in opponents shooting poorly against him, but it masked some of his value on the typical box score.

Besides a few plus-minus stats, however, Shane Battier never had an extraordinary signal on the box score. Despite being a defensive specialist, he averaged just over one block and steal a night.
There is some merit to the box score, but still, within context. Points per game can be a decent indicator of who the best scorers are, but it takes an extra step of logic to get there. The extra step is derived from the idea that per game stats are still ultimately counting stats, despite the “per game” label. A biased coach might identify which players are the best, or the reputation of the player might precede them - but usually, the ‘best’ (I’ll explain this more) players are the ones who have the ball in their hands, which then lead to more points. This is useful for assessing first, second, or third-year players because a young player who scores a lot despite being inefficient can develop into an efficient scorer over time with development and personnel changes. Similarly, a player who currently plays efficiently with a smaller role may develop the ability to handle a larger offensive load in the future.
The only issue with applying this logic to rankings is that it is circular. If the best players are the ones scoring the most points, we could never know which players might score better a.k.a. more efficiently. That’s where percentages come in as a metric1. Without giving an enormous deep dive into the way we calculate field goal percentages now, just know that while points per game are useful to say, “I think the coach believes in this player as a shot-creator or shot-maker”, it isn’t always conducive to how good of an offensive player someone is, nor does it account for the variety of players who excel in smaller roles.

But before you label me as a basketball pariah, just know that I am not nearly as extreme as some people, specifically Daryl Morey, who said that the person who created the box score should be shot. But how does this all relate to Battier?
Let’s look at this visualization again. You can see that Bryant actually gets more points against Battier compared to his average against other teams. So, after a forty-something explosion, Kobe fans might feel validated - and scornful at the Battier supporters who claim the Black Mamba got locked up. This type of nonsense pervades the sport constantly - the idea that above a certain threshold of points, a player is permitted to take as many shots as they like.
Battier took advantage of this constantly. He noted in Lewis’ article, “If he has 40 points on 40 shots, I can live with that,” Battier says. “My job is not to keep him from scoring points but to make him as inefficient as possible.”
Inefficient is a good term to use, and it’s highly representative of the shots Battier made his opponent take. Even against Bryant, who is one of the best midrange shooters the game has seen, Battier employed techniques to reduce his overall efficiency.
Perhaps my favorite quote from the article is this one from Hinkie: “I care a lot more about what ought to have happened than what actually happens”. Just like any other stochastic game, the best way to score is by getting the most efficient shot possible, and the best way to defend is to force the other team to take the least efficient shot possible.
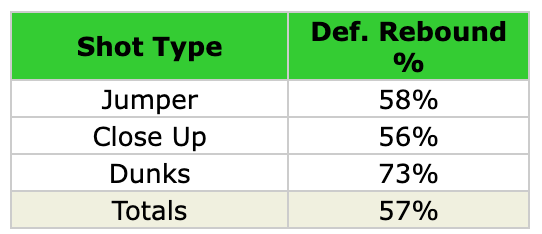
A player’s effectiveness at doing the latter cannot be measured with blocks or steals, both of which are just play outcomes. That’s why Stephen Curry won the steals title in 2016 despite being a minus defender. Oftentimes, players who average a ton of blocks or a ton of steals might actually just be gambling too much on the defensive end - Hassan Whiteside and Allen Iverson stick out for this. A good defender might not always signal so highly on the box score, but there are other ways to statistically impact the game. For one, Battier deduced that the better way to defend is to force his opponents into shots that can be more effectively careened into defensive rebounds. A block, while a plus one to the box score, is less often collected by the defensive team than a regular jumpshot.
Battier also often forced players into long, contested, midrange shots. I wanted to see if this extended to the Rockets as a whole - and if they were actually ahead of the curve in terms of the analytics revolution.
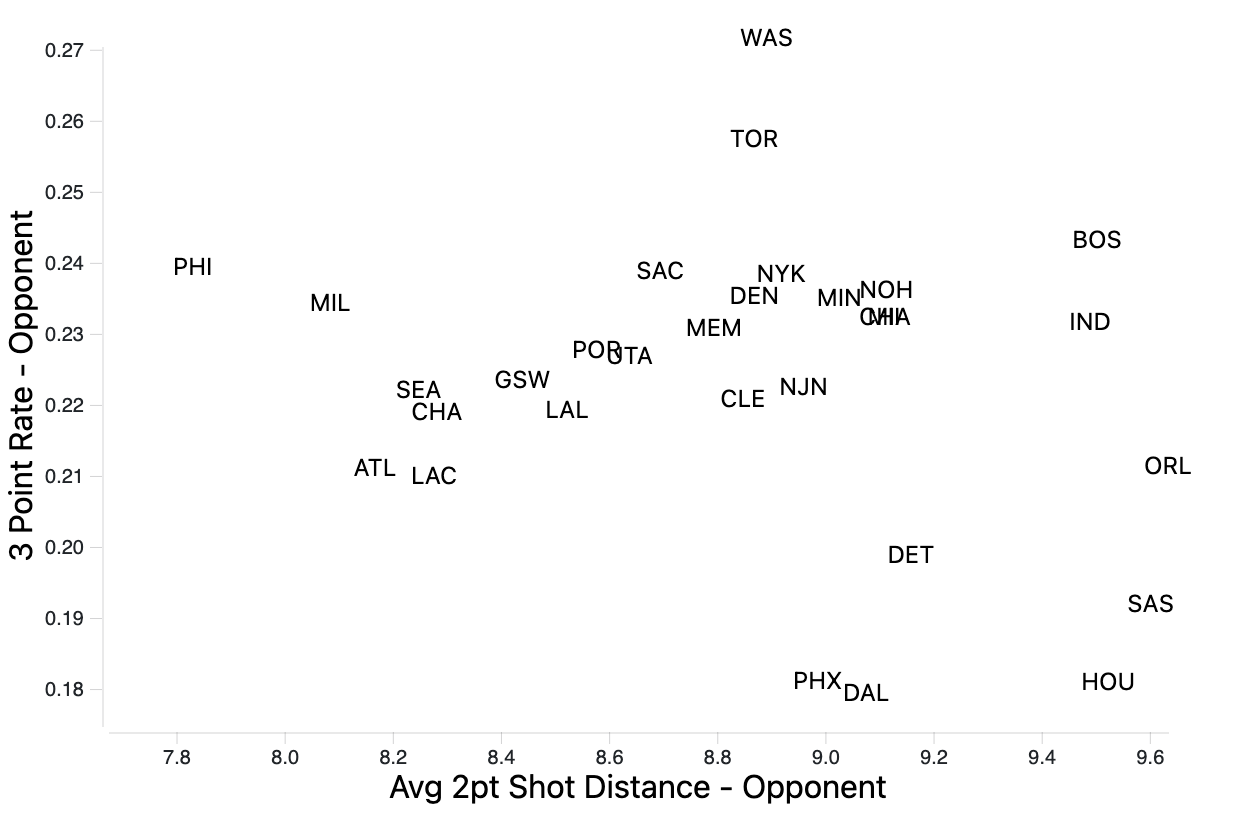
I find it interesting, but not surprising, that Morey (who later pioneered MicroBall) consistently forced teams to shoot less threes. One might think then, they might have been beaten off the catch-and-shoot three territory more easily, but remarkably, they rank near the top of 2PT Shot Distance as well. This is a testament to Battier and the other defensive stalwarts on the Rockets (including Yao Ming, who very few people wanted to challenge near the rim).
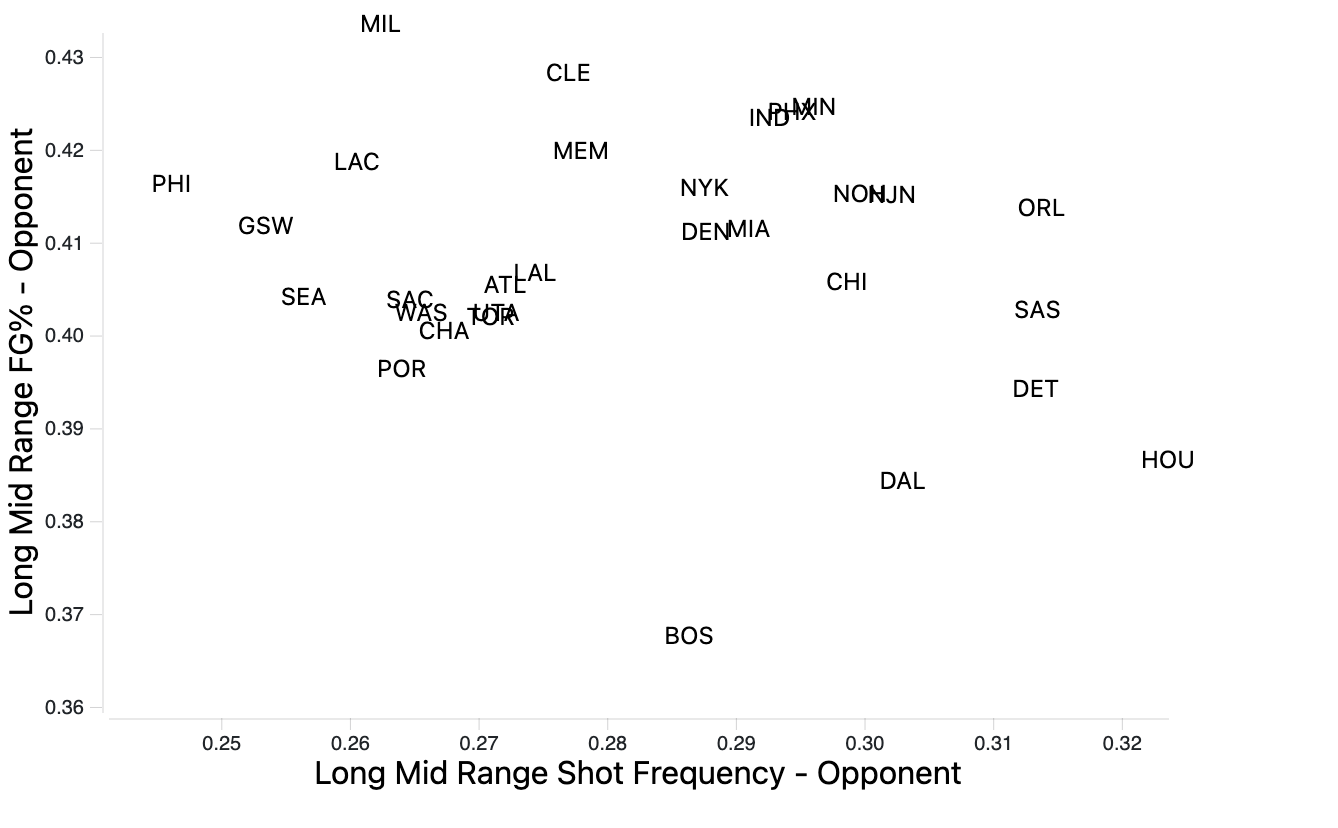
This visualization shows that those Rockets limited their opponents to low field goal percentages on their long twos, while also goading them into taking more than they did against any other team in the NBA.
Similarly to the 2002 Oakland Athletics, whose General Manager Billy Beane pioneered Moneyball, the Rockets went on an unprecedented 22 game winning streak in 2008 - largely due to Battier’s stellar defensive performance. Their 22nd win was capped off with Battier holding Bryant to 24 points (hey, that’s pretty good) on 11-33 shooting (oh).
You might be wondering - why the hell is Charles Barkley in the title? Chuck, in his famous rant on TNT, notes that just because the numbers say something doesn’t mean that it’s true. He then follows that up by saying, you can’t be a good defensive team if you’re giving up 118 points per game.
Is 118 not a number? Hmm. Then Barkley notes that Daryl Morey is just going out and getting the best players. But, Sir Charles, how do we non-NBA players know who the best players are? Can the brain memorize all the thousands and thousands of rows of play-by-play data on my computer? I think I’d need a good reference. And then, if I was to analyze, would I just selectively choose maybe 10-20 games for each team to determine my opinions on the player?
But in this clip, Barkley notes Lonzo Ball had a triple-single, but then if I cross-reference that with his earlier statement about how numbers don’t carry the full context, what am I to think? Should I look at the box score, which we’ve already established is flawed at its core?
Ultimately, the idea is that we do need numbers. And Barkley is right, numbers don’t tell the full story, but unbeknownst to most people, statistics is actually the process of giving context. I’d guess (the irony wouldn’t be lost on me if I attached a number) that the reason Barkley and many other players have waged war on analytics is because they’re used to doing things a certain way and don’t enjoy change. Funniness aside, the educational value of the TNT broadcast will surely not be missed.
Ultimately, the power of stats always depends on the context in which they are being used but also derived. A lot of the doubt around sports statistics comes from both people who don’t know anything about them (Mr. Barkley) and rightful doubters (myself and many other people who have devoted themselves to coming up with more widely-connected metrics).
Battier cracked my favorite 21 players list for what might seem like obvious reasons - but in my youth, I despised him. I derided him as dirty in that 2013 Finals, and cheered with all of my heart when he shot an ice cold 6/19 in the first six games of the series. Then, regression to the mean.
So much for the ‘No-Stats’ All Star.
Just around the same time I was writing this, my lovely (yet cranky) girlfriend woke up from her nap and rolled her eyes at me for no reason. In the spirit of this article, I asked her how many eye rolls she averages per day, to which she responded that she doesn’t know, but if there was a percentage attached to her eye rolls, the bulk of her physical attitude is towards me.
So, even though my girlfriend’s eyes glaze over every time I talk about basketball, she understands the basic principles of statistics better than a certain player from Alabama.